Data Explorer - Iris Dataset
Data Explorer - Iris Dataset
An interactive web application built with Shiny for exploring and visualizing the Iris dataset. This app allows you to filter data by species and view correlations between sepal and petal measurements.
Preview
The Data Explorer app provides an interactive interface for analyzing the Iris dataset:
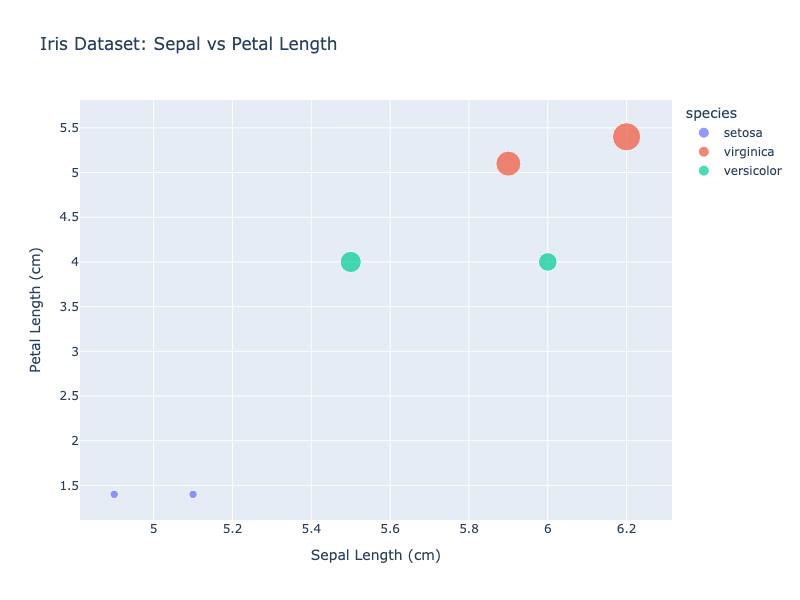
This visualization shows the relationship between sepal length and petal length, colored by species. The app allows you to filter by species and view detailed measurements for each data point.
Interactive Demo
Interact with the live Shiny application below:
Features
- Species Filter: Select individual iris species or view all data
- Interactive Visualization: Hover over data points to see detailed measurements
- Data Table: View the filtered dataset in a formatted table
- Dynamic Updates: All visualizations update in real-time based on your selection
Running the App Locally
To run this application on your machine:
# Install dependencies
pip install -r requirements.txt

# Start the Shiny app
cd projects/data
shiny run app.py
Then visit http://127.0.0.1:8000 in your browser.
Project Details
Technology Stack: - Python 3.9 - Shiny for Python - Pandas for data manipulation - Plotly for interactive visualizations
Repository: add links to notebooks and artifacts.